

Market Flash - Rethinking AI after Nvidia's Leadership Shock
Key Takeaways
- AI success does not guarantee investor success. AI can raise productivity, but competition can push those benefits to customers through lower prices rather than higher profits for shareholders. The scale and speed of the AI buildout raise the stakes.
- The next phase of AI investing will require greater selectivity. AI exposure alone is not enough. What investors pay for growth, profitability and quality matters.
- KIM’s Active Equity strategies take a more selective approach to AI. They have less meaningful AI exposure than their benchmarks, while generally owning AI-exposed companies with lower valuations and equal or better quality and growth.
AI can be a truly revolutionary technology while the companies that enable it still face setbacks. Jensen Huang’s sudden departure from Nvidia is the latest reason to question the risks surrounding the AI boom, but it is actually not the most important one.
Investors should instead focus on whether AI businesses will earn enough to justify trillions of dollars in planned investment. The technology may improve productivity while competition pressures prices and profits. The next phase of AI investing should be focused on what investors are paying for the growth and profits that exposure ultimately produces.
Better Technology Can Mean Lower Profits
AI promises to help businesses produce more at a lower cost. Investors may assume that means higher profits. But what happens when competitors all get the same technology? A simple example shows why the answer matters.
Consider a town’s bakeries. Give one bakery an oven that makes twice as much bread at the same cost, and it gains an advantage over its rivals. Give every bakery that oven, and that advantage disappears. If they all double production, people aren’t twice as hungry. Unsold loaves pile up, bakeries cut prices, and profits can fall.
The ovens have delivered exactly what they promised. Customers get cheaper bread. Yet the bakery owners may earn less.
The same risk applies to AI. When competitors can use the same tools, competition can pass the savings to customers rather than leave them as extra profits for shareholders.The reality is that higher productivity does not guarantee higher profits or higher margins.
AI Could Put Software – and Other Firms’ Profits - Under Pressure
AI can make useful software cheaper to build. Competitors may then offer similar products for less, or even for free.
An October 14, 2026, Futurism article reports that developers used Anthropic’s AI tool Claude to create free alternatives to Adobe products, including Photoshop, Lightroom and Premiere. It also reports that ArtCraft announced free alternatives to Microsoft Word, Excel and PowerPoint, called WordCraft, GridCraft and DeckCraft. ArtCraft charges for optional AI image and video services.1
If free alternatives become good enough, established providers may have to cut prices or lose customers. That raises a serious question for businesses such as Adobe and Microsoft 365: how much will customers keep paying? The article does not show that the alternatives match every feature, that customers are switching in large numbers, or that profits have collapsed.
Examples beyond software show how AI can put profits under pressure:
- IFIS Japan: AI brought translation in-house; division operating profit fell 24.1% (Jan–Sep 2026).2
- Chegg: AI weakened paid-study demand; adjusted net profit fell 59% (Q2 2025).3, 4
- Straker: AI squeezed translation prices; gross profit fell 18.8% (FY2026), amid other pressures.5
- Reach: AI search hurt readership; adjusted operating profit fell about 4% (H1 2026); print also fell.6, 7
- Japanese translators: net profit fell 70.7% (FY2022–25) amid AI-driven price competition.8
AI can be a spectacular success for its users without being a spectacular investment for its shareholders.
Projected AI Spending Exceeds Past Infrastructure Booms
Pressure on profits matters when companies are committing enormous sums. The Wall Street Journal cites projected US investment of $10.3 trillion in data centers and related AI infrastructure from 2025 through 2032. Annual spending would average 3.63% of US economic output (GDP), above all the historical booms shown.9
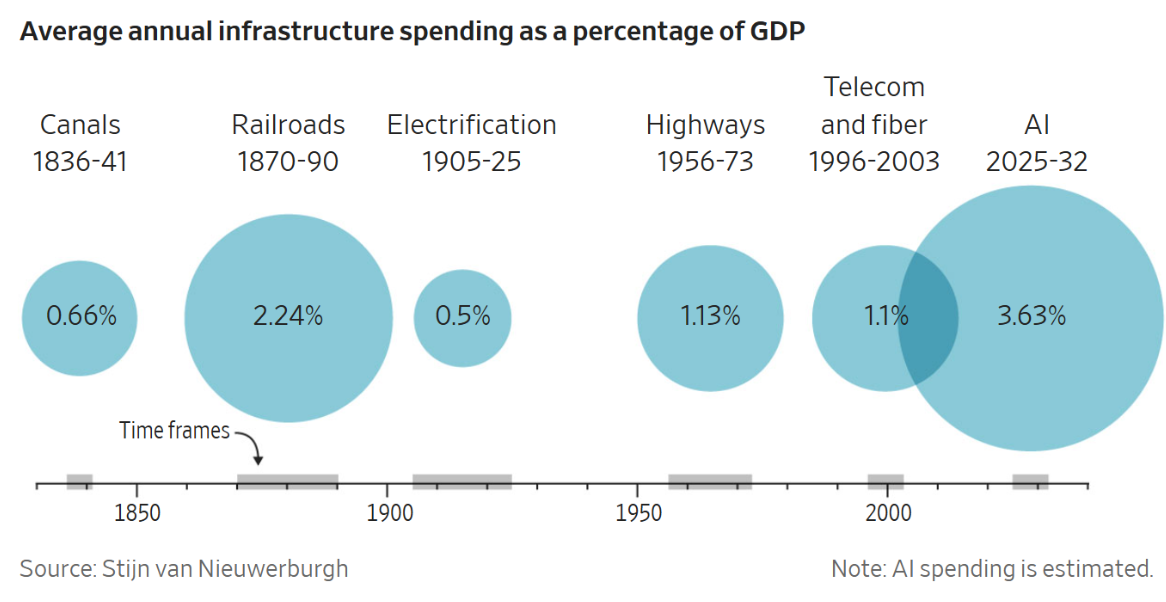
Source: The Wall Street Journal; estimates by Stijn van Nieuwerburgh. AI spending for 2025–32 is projected.10
AI Investment Is Rising Unusually Quickly
The Bank for International Settlements (BIS) compares how quickly investment grew during different booms. Spending by the major AI cloud companies reaches more than four times its starting level. The next biggest investment bubble, the canal boom, peaked after roughly five years. AI’s 2026 figure uses announced spending plans.11 Paul Kedrosky describes the pace as “about half the time” of earlier booms. He argues that capacity is being built ahead of demand, putting future returns at risk.12
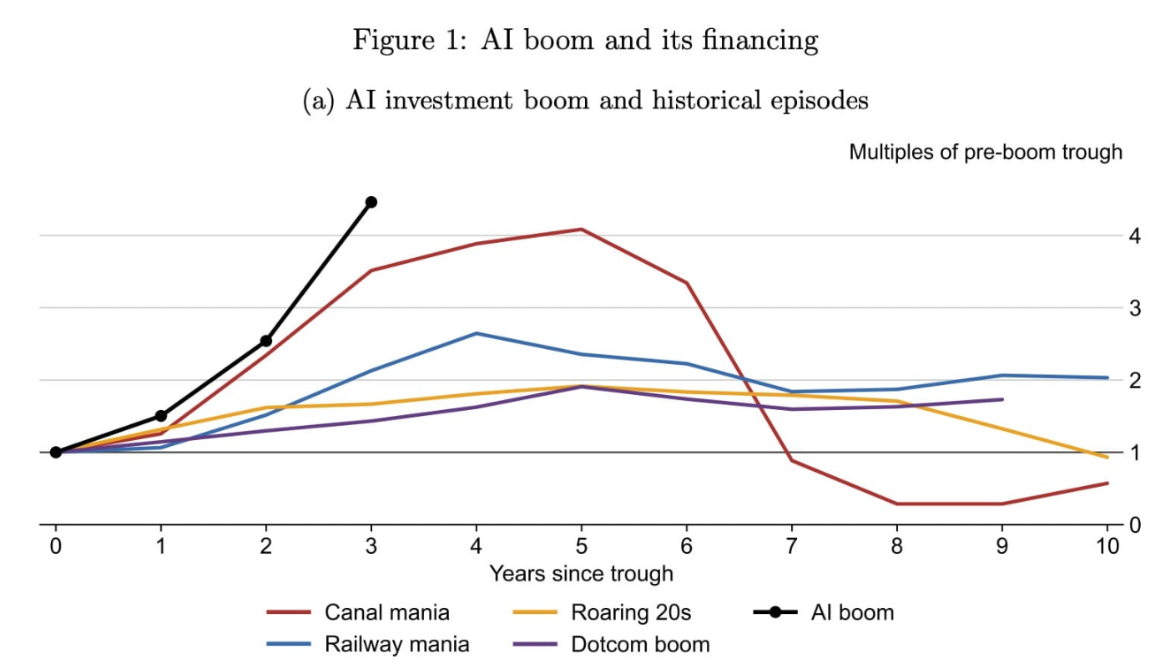
Source: BIS Working Paper No. 1367, Figure 1(a), also reproduced by Paul Kedrosky. The 2026 AI figure uses announced spending plans.13
Debt and Shared Funding Can Spread Losses
A working paper from the BIS, which serves central banks, explains how this race could go wrong. Each company may spend heavily to avoid falling behind, even when the industry as a whole is building more than future revenue can justify.14 The paper’s full model puts early investment about 40% above the level it identifies as the best use of resources. A simpler version puts the excess at about 50%. These estimates depend on the model’s assumptions.15
If revenue disappoints, companies may stop expanding while still owing money on what they built. Selling specialized equipment at the same time can drive resale prices down and deepen losses.16 Funding ties can spread the damage. A large technology company may invest in an AI developer that promises to rent its computing power. If the developer fails, its backer could lose money and cut support for another developer.17
These deals can fund useful projects while making the companies more dependent on one another.18 The paper does not predict an inevitable crash. Strong demand and productivity gains could justify substantial investment. Its warning is that useful technology can still be financed and built in ways that produce heavy investment losses.19
KIM Active Equity Strategies and Their AI Exposure vs. Benchmarks
KIM’s Active Equity series participates in AI with less portfolio exposure to stocks that have meaningful20 AI exposure than each strategy’s respective benchmark. Simply put: KIM Active Equity series AI-exposed holdings are less expensive, higher quality companies that are typically growing faster than their AI exposed peers in their benchmarks.
Each bold KIM row is paired with its benchmark directly underneath.
- Meaningful AI Exposure shows how much of the entire portfolio or benchmark is invested in AI-exposed stocks.
- The remaining five columns describe only those AI-exposed stocks.
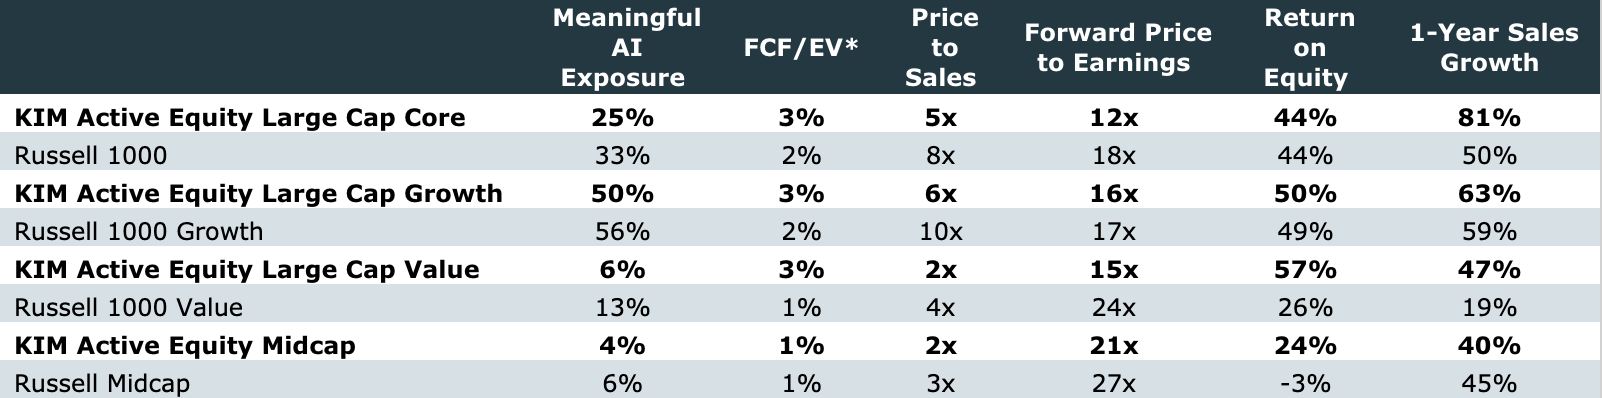
Source: L2 Asset Management, LLC. Data as of October 31, 2026.21 *FCF/EV = Free Cash Flow to Enterprise Value.
Within those AI-exposed holdings, the figures show:
- Lower price-to-sales and price-to-earnings multiples in all four KIM strategies.
- Higher free-cash-flow yield in the three large-cap strategies, with Midcap matching its benchmark at 1%.
- Equal or higher return on equity in every strategy: Large Core matches its benchmark; the other three exceed theirs, denoting the holdings in the entire Active series are of equal or higher quality than their benchmark peers.
- Higher one-year sales growth in the three large-cap strategies. Midcap is the exception: 40% versus 45%. So in all the KIM Active Equity Large Cap strategies you are paying less for higher quality and faster growing AI exposed companies than their benchmark. In the one strategy where the growth is lower, Midcap, both the strategy and the benchmark have ~5% exposure to names with meaningful AI exposure.
Endnotes
1. Victor Tangermann, Creator of Free Adobe Suite Strikes Again, Reverse Engineers Microsoft Office, Futurism, October 14, 2026, saved PDF pp. 1–3. Reports developer claims and free product offerings. It does not establish full feature equivalence, widespread customer switching or falling profits.
2. IFIS Japan, Financial Results for the Nine Months Ended September 30, 2026, November 12, 2026, printed p. 3 (PDF p. 5). The Language Solutions division reported revenue of ¥957 million, down 9.4%, and operating profit of ¥51 million, down 24.1%. Management explicitly attributes fewer orders and lower sales and profits to customers using AI to bring translation in-house. These are division results; the parent company also has IT operations, and its consolidated operating and net profits increased. Japanese-language disclosure; figures compare January–September 2026 with the same period in 2025.
3. Chegg, Chegg Reports 2025 Second Quarter Earnings, August 4, 2025, financial tables and CFO commentary. Second-quarter non-GAAP net income fell from $26.496 million in 2024 to $10.801 million in 2025, a calculated decline of 59.2%. Revenue fell 36% and subscribers fell 40%. Management attributed lower traffic largely to Google AI Overviews. This is an adjusted profit measure, excluding selected expenses and gains; the GAAP net loss narrowed because the prior period included a large impairment. The company did not isolate AI’s exact contribution to the earnings decline.
4. Reuters, Chegg to lay off 22% of workforce as AI tools shake up edtech industry, May 12, 2025. Reports students shifting toward ChatGPT and other AI tools, Chegg’s explanation that Google AI Overviews reduce traffic reaching its website, and plans to eliminate 248 jobs. This article establishes the competitive disruption; the separately cited August earnings release supplies the second-quarter profit comparison.
5. Straker, Annual Report 2026, year ended March 31, 2026, printed pp. 5 and 13–15. Management states that AI performs much translation work at a fraction of its former price, pressuring per-word billing, and that efficiency alone does not reverse that pressure. Gross profit fell 18.8%, from NZ$30.582 million to NZ$24.832 million. Managed-services revenue fell 28.8%, primarily reflecting revised pricing and efficiency gains passed to customers. Other influences included business mix, strategic changes and regional demand weakness. A separate fraud also materially worsened net earnings; the net loss should not be attributed solely to AI. Straker also sells technology products and is moving toward AI verification services. The bullet refers specifically to gross profit, not net income.
6. Proactive Investors, Reach shares slump 19% as AI answers hits Google search traffic, July 22, 2026. Explains how Google AI Overviews can answer users’ questions without a visit to the original publisher, weakening advertising income. Reports Reach’s 40% decline in page views and 11.4% decline in digital revenue. This mechanism is one contributor to disruption; neither the article nor the company quantifies AI’s isolated contribution to the profit decline.
7. Reach plc, Half Year Results for the Six Months Ended June 30, 2026, July 22, 2026, printed pp. 1 and 6–7. Adjusted operating profit fell from £44.8 million to £43.0 million, approximately 4%. Page views fell 40% and digital revenue fell 11.4%. Print revenue also declined 8.3%. The bullet identifies adjusted operating profit: adjusted profit after tax actually rose from £33.9 million to £34.9 million. Statutory losses also reflect substantial impairment, amortisation and restructuring charges, which should not all be assigned to AI.
8. Tokyo Shoko Research, Translation industry in difficulty: profits down 70% in three years, with bankruptcies amid AI competition [translated title], TSR Data Insight, September 21, 2026. Study of 100 Japanese translation companies with comparable results over five consecutive fiscal years. Combined net profit fell from ¥3.082 billion in fiscal 2022 to ¥902 million in fiscal 2025, a 70.7% decline; combined revenue fell 9.7%. The study describes rapidly improving machine translation, free alternatives and intensifying price competition. This is an aggregate decline, not a 70.7% decline at every company. It does not measure how much of the decline AI caused, and the result should not be presented as AI-only causation. Original source is in Japanese.
9. Konrad Putzier and Justin Lahart, The AI Build-Out Is Becoming the Biggest Economic Bet in U.S. History, The Wall Street Journal, September 24, 2026, saved PDF pp. 1–2. Projection attributed to Stijn van Nieuwerburgh and published by Brookings. The 3.63% figure is the average annual share of GDP. Historical comparisons use different time periods; future spending may be substantially lower.
10. Konrad Putzier and Justin Lahart, The AI Build-Out Is Becoming the Biggest Economic Bet in U.S. History, The Wall Street Journal, September 24, 2026, saved PDF p. 1. Chart of average annual infrastructure spending as a share of GDP. The AI figures for 2025–32 are estimated.
11. Phurichai Rungcharoenkitkul, The AI Investment Race, BIS Working Papers No. 1367, July 7, 2026, Figure 1(a), printed p. 3 (PDF p. 5). AI spending is indexed from 2023 and uses announced plans for 2026. Canal investment is indexed from 1835. The chart compares growth from each pre-boom low, rather than absolute size or GDP shares.
12. Paul Kedrosky, AI Capex Boom Now Exceeds All Prior Non-War Booms, July 14, 2026, accessed November 12, 2026. The public opening describes the pace as about half that of earlier booms and argues that capacity is being built ahead of economically justified demand. The chart’s canal comparison is approximately three years versus five. The subscriber-only remainder was not used.
13. Phurichai Rungcharoenkitkul, The AI Investment Race, BIS Working Papers No. 1367, July 7, 2026, Figure 1(a), printed p. 3 (PDF p. 5). Chart reproduced from the supplied image. It covers US canals, British railways, the US 1920s, dotcom and AI spending by major cloud companies. The 2026 AI point uses company guidance.
14. Phurichai Rungcharoenkitkul, The AI Investment Race, BIS Working Papers No. 1367, July 7, 2026, printed pp. 2 and 11–14 (PDF pp. 4 and 13–16). The model shows how competition for dominant positions can drive investment above the level that makes the best collective use of resources. This does not establish that every project is uneconomic.
15. Phurichai Rungcharoenkitkul, The AI Investment Race, BIS Working Papers No. 1367, July 7, 2026, printed pp. 22–23 (PDF pp. 24–25). The full model gives investment of 1.40 times its benchmark; the simpler calculation gives 1.51 times. These conditional estimates mean approximately 40% and 50% above the benchmark, respectively.
16. Phurichai Rungcharoenkitkul, The AI Investment Race, BIS Working Papers No. 1367, July 7, 2026, printed pp. 15–17 and 28 (PDF pp. 17–19 and 30). Weak returns can halt further investment and trigger losses on existing capital. Debt-financed assets sold together account for most of the model’s estimated destruction of committed capital in a downturn.
17. Phurichai Rungcharoenkitkul, The AI Investment Race, BIS Working Papers No. 1367, July 7, 2026, printed pp. 29–35 (PDF pp. 31–37). A developer’s failure can reduce a backer’s borrowing capacity and cause it to withdraw support from other developers. The simulations are illustrative and anonymized, not predictions about named companies.
18. Phurichai Rungcharoenkitkul, The AI Investment Race, BIS Working Papers No. 1367, July 7, 2026, printed pp. 7, 29–35 and 43–44 (PDF pp. 9, 31–37 and 45–46). Equity investments linked to future computing purchases can help useful partnerships work, while shared financial exposures can transmit distress.
19. Phurichai Rungcharoenkitkul, The AI Investment Race, BIS Working Papers No. 1367, July 7, 2026, printed pp. 28–29 and 35–36 (PDF pp. 30 31 and 37–38). Numerical thresholds and probabilities are illustrative, not forecasts. Sufficiently large productivity gains may justify planned investment. The author’s views are not necessarily those of the BIS or its member central banks.
20. A company is classified as having “meaningful” AI exposure if AI demand is a core driver of its revenue or growth today, as evidenced in reported figures (orders, backlog or segment revenue) and not solely in product announcements, future plans or share-price narrative. A company qualifies if it meets any one of three tests: (i) a disclosed AI or data center line representing roughly one-third or more of sales; (ii) management identifies AI or data centers as the primary source of growth or backlog, even without a revenue breakout; or (iii) AI drives the company’s core product or economics. The classification is judgment-based, with no fixed numeric threshold, and a company counts at its full portfolio weight even where only part of its revenue is AI-related.
21. L2 Asset Management, LLC, KIM strategy and benchmark AI-exposure comparison, data as of October 31, 2026, supplied table. Compares KIM Large Core, Large Growth, Large Value and Midcap with their respective Russell benchmarks. Exposure is measured against the entire portfolio or benchmark; valuation, cash-flow yield, return on equity and sales-growth figures apply to the AI-exposed holdings. Comparisons use the displayed, rounded figures.
The opinions expressed in this commentary are those of the author and may not necessarily reflect those held by Kestra Advisor Services Holdings C, Inc., d/b/a Kestra Holdings, and its subsidiaries, including, but not limited to, Kestra Advisory Services, LLC, Kestra Investment Services, LLC, Kestra Private Wealth Services, and Bluespring Wealth Partners, LLC. The material is for informational purposes only. It represents an assessment of the market environment at a specific point in time and is not intended to be a forecast of future events, or a guarantee of future results. It is not guaranteed by any entity for accuracy, does not purport to be complete and is not intended to be used as a primary basis for investment decisions. It should also not be construed as advice meeting the particular investment needs of any investor. Neither the information presented nor any opinion expressed constitutes a solicitation for the purchase or sale of any security. This material was created to provide accurate and reliable information on the subjects covered but should not be regarded as a complete analysis of these subjects. It is not intended to provide specific legal, tax or other professional advice. The services of an appropriate professional should be sought regarding your individual situation. Kestra Advisor Services Holdings C, Inc., d/b/a Kestra Holdings, and its subsidiaries, including, but not limited to, Kestra Advisory Services, LLC, Kestra Investment Services, LLC, Kestra Private Wealth Services, and Bluespring Wealth Partners, LLC, do not offer tax or legal advice.