
Markets in a Minute - Small and Mid Caps are Re-Entering the Conversation
The past three years have been an excellent time to be an investor. From 2023-2025, the S&P 500 delivered a 23% annualized return, thanks largely to enthusiasm over artificial intelligence (AI) and the outsized impact of the Magnificent Seven. These mega-cap stalwarts have become essential portfolio building blocks, with their strong earnings, diversified business models, and central role in AI. For the last few years at least, bigger has been better.
To put this into perspective, the mid-cap S&P 400 index and small-cap S&P 600 index returned 13% and 10%, respectively, over the same three-year period. Those are strong returns to be sure, but well short of what the largest companies delivered. Yet for the first time during this extended bull run, we are starting to see signs that a shift could be underway.
For instance, in January, the small-cap index led the way with a 5.6% return and mid-caps were up 4.1%. Meanwhile, the S&P 500 lagged, moving up just1.5%. Given the dependable performance of the biggest companies in the market, it might be fair to ask whether this is a sustained rotation into a broadening rally or just another false start? In this week’s Markets in a Minute, we evaluate the merits of the recent rally in the small- and mid-cap (SMID) universe and explore whether they can lead the next leg higher for the market.
Last 3 Years Annualized and 2026 Year-To-Date Performance: S&P 500, S&P 600, and S&P 400
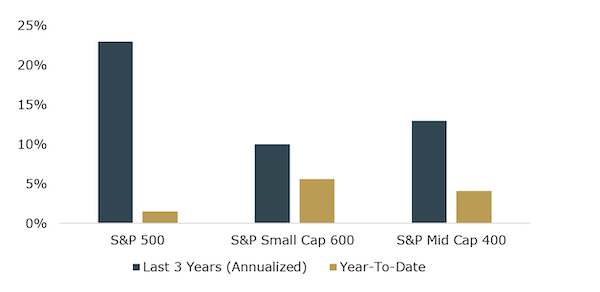
Source: Kestra Investment Management with data from FactSet. Past performance is not a reliable indicator of current or future results. Indexes are unmanaged and not subject to fees. It is not possible to invest directly in an index. This material represents an assessment of the market environment at a specific time and is not intended to be a forecast or guarantee of future results. Indexes: S&P 500, S&P Mid Cap 400, and S&P Small Cap 600. Year-to-date data as of January 31, 2026.
Macro Tailwinds Support Rotation
One benefit for the SMID caps is lower interest rates. After three rate cuts in late 2025 by the Federal Reserve, borrowing costs declined. Unlike the biggest companies that generally don’t rely heavily on borrowing, smaller firms often take on more substantial levels of debt, leaving them extra sensitive to the level of rates and Fed policy.
In addition to lower financing costs, small- and mid-sized companies, in aggregate, have lower valuations than their larger counterparts. At the end of 2025, the forward price-to-earnings ratio of the S&P 500 reached a multi-decade high of 22.1x, compared to a long-term average of 16.6x. Meanwhile, the forward price-to-earnings ratios for the mid-cap S&P 400 and small-cap S&P 600 are more in line with their usual long-term levels. For the mid-cap benchmark, it closed the year at 15.9x while the small-cap S&P 600 finished the year at 14.7x.
Valuation gaps alone don’t trigger rotations. However, when they are paired with improving financing conditions and stronger fundamentals, leadership can broaden.
Speaking of fundamentals, the earnings backdrop for the SMID caps is setting up nicely after a challenging period. In 2023 and 2024, both small- and mid-caps earnings growth lagged the S&P 500 significantly. But 2026 could see a marked shift: Morningstar reports that earnings for the S&P Small Cap 600 are expected to grow by 19% and the S&P Mid Cap 400 by 17%. Both of those numbers are higher than the 14% estimate for the S&P 500.
YoY Annual Earnings Per Share Growth Rates – S&P 500, S&P 600, and S&P 400
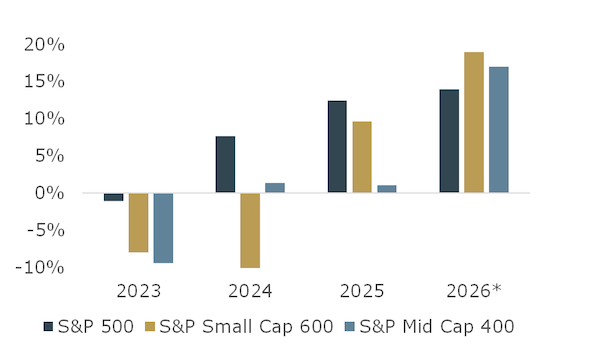
* - 2026 estimates from a Morningstar poll of FactSet analysts. Source: Kestra Investment Management with data from Bloomberg and Morningstar. Past performance is not a reliable indicator of current or future results. Indexes are unmanaged and not subject to fees. It is not possible to invest directly in an index. Indexes: S&P 500, S&P Mid Cap 400, and S&P Small Cap 600.
The Risks to the Story
SMID-cap stocks have had false starts before; several risks could still disrupt this stretch of outperformance. Any stress that materializes in the credit markets will hit smaller companies harder due to their debt-heavy profile. With credit spreads at historically low levels, any shock that emerges could stall the rotation. While earnings expectations for small- and mid-cap companies have trended higher as financing conditions improved, actual earnings may still disappoint.
Bottom Line: A Rotation Worth Watching
While large-cap companies have contributed the lion’s share of US stock market gains over the last few years, investors should recall that over the very long term, smaller companies have actually tended to outperform their larger peers. In addition, because of the extended outperformance of large caps, they represent a much larger proportion of many investor portfolios. Maintaining exposure to small and mid-sized stocks ensures that investors right size risk in their portfolios and potentially benefit from a more sustained rotation to smaller companies.
As always, invest wisely and live richly.
Kara
The opinions expressed in this commentary are those of the author and may not necessarily reflect those held by Kestra Advisor Services Holdings C, Inc., d/b/a Kestra Holdings, and its subsidiaries, including, but not limited to, Kestra Advisory Services, LLC, Kestra Investment Services, LLC, and Bluespring Wealth Partners, LLC. The material is for informational purposes only. It represents an assessment of the market environment at a specific point in time and is not intended to be a forecast of future events, or a guarantee of future results. It is not guaranteed by any entity for accuracy, does not purport to be complete and is not intended to be used as a primary basis for investment decisions. It should also not be construed as advice meeting the particular investment needs of any investor. Neither the information presented nor any opinion expressed constitutes a solicitation for the purchase or sale of any security. This material was created to provide accurate and reliable information on the subjects covered but should not be regarded as a complete analysis of these subjects. It is not intended to provide specific legal, tax or other professional advice. The services of an appropriate professional should be sought regarding your individual situation. Kestra Advisor Services Holdings C, Inc., d/b/a Kestra Holdings, and its subsidiaries, including, but not limited to, Kestra Advisory Services, LLC, Kestra Investment Services, LLC, and Bluespring Wealth Partners, LLC, do not offer tax or legal advice.