
Week of July 21, 2025
Published every Monday: Get a detailed snapshot of what moved the markets last week—and what to watch this week.
Big Tech Helps Nasdaq, S&P 500 Reach New Highs
U.S. equities continued to move higher last week, with the S&P 500 and Nasdaq Composite reaching new highs. Big tech helped drive performance higher. Financials also outperformed, with many firms reporting solid earnings. Energy, health care, and materials underperformed. The Treasury curve steepened.
Weekly Quick Hits
![]()
We analyze data on housing, consumer confidence, retail sales, and consumer and producer prices.
BEYOND THE HEADLINES:
Fiscal and Monetary Policy: Where Do We Stand?
Companies saw movements in share prices from several government actions. We saw chip-related companies rise after Nvidia announced it would be allowed to sell its H20 AI chip in China. Managed care organizations saw declines in their share prices, with several exposed to possible declines in Medicaid funding. Significant volatility in equities and fixed income arose on news that President Trump was considering firing Federal Reserve (Fed) Chair Jerome Powell. After the president denied those rumors, the market hit new highs at the end of the week.
How Should Investors React to Government Actions?
In a year of extreme volatility, markets have continued to hit new highs. It has been difficult to determine which policies are permanent and which could be reversed—as was the case with several tariff policies announced earlier this year. With another trade deadline approaching August 1 for the European Union and several other countries, more back-and-forth on tariff policy could occur. Equity markets still boil down to how much companies earn and what investors are willing to pay for them. Focusing on fundamentals and valuations for those firms can help tune out some of the noise. Although government policy can have a major impact on earnings, it’s best to consider the long-term earnings of companies that have operated through various political environments. Don’t count out the ability of firms to adapt.
Tariff actions, which have been primarily implemented through executive action, may be less permanent than items that have been implemented through Congress. Investments should typically be considered on a time horizon that outlasts the current administration. For those who need access to investments in a shorter time frame, considering lower-risk investments (e.g., fixed investments) that match their investment timeline may be appropriate.
What Should We Look Forward To?
Although it’s important to watch what happens in Washington, we’ll see ample hard data from companies that are reporting over the next few weeks. Innovations in AI are driving earnings higher for many companies—even as they face trade policy uncertainty. Valuations remain close to Covid-era levels, which means markets are dependent on the continued earnings growth we are seeing from several tech companies. Many pockets of the market are trading at lower valuations, with a lower bar for beating earnings. As this year has shown, there are many ways to diversify your portfolio. Different pockets, including value stocks, growth stocks, and international stocks, have outperformed at various times. Small- and mid-cap stocks are trading closer to their historical average valuations than large-caps.
From a fiscal perspective, we’ve removed some uncertainty now that H.R. 1 (i.e., the One Big Beautiful Bill Act) has passed. The back-and-forth from tariff policy won’t last forever. We recommend watching earnings and valuations as you look to navigate the uncertainty.
“In a year of extreme volatility, markets have continued to hit new highs.”
Report Releases: July 14-18, 2025

Consumer Price Index (CPI) June (Tuesday)
The CPI showed rising consumer inflation, with headline and core consumer price growth accelerating.
- Prior monthly CPI/core CPI growth: +0.1%/+0.1%
- Expected monthly CPI/core CPI growth: +0.3%/+0.3%
- Actual monthly CPI/core CPI growth: +0.3%/+0.2%
- Prior year-over-year CPI/core CPI growth: +2.4%/+2.8%
- Expected year-over-year CPI/core CPI growth: +2.6%/+2.9%
- Actual year-over-year CPI/core CPI growth: +2.7%/+2.9%

Producer Price Index (PPI) June (Wednesday)
Producer inflation missed economist estimates; a sharp drop in travel-related service prices kept overall price growth in check.
- Prior monthly PPI/core PPI growth: +0.3%/+0.4%
- Expected monthly PPI/core PPI growth: +0.2%/+0.2%
- Actual monthly PPI/core PPI growth: +0.0%/+0.0%
- Prior year-over-year PPI/core PPI growth: +2.7%/+3.2%
- Expected year-over-year PPI/core PPI growth: +2.5%/+2.7%
- Actual year-over-year PPI/core PPI growth: +2.3%/+2.6%

Advance Retail Sales June (Thursday)
Retail sales beat expectations after falling notably in May, with headline and core sales growing.
- Expected/prior month retail sales monthly change: +0.1%/–0.9%
- Actual retail sales monthly change: +0.6%

NAHB Housing Market Index June (Thursday)
Although home builder confidence edged up slightly, the index remained in contractionary territory.
- Expected/prior month NAHB Housing Index: 33/32
- Actual NAHB Housing Index: 33

Housing Starts and Building Permits June (Friday)
Housing starts and building permits increased more than expected.
- Expected/prior month housing starts monthly change: –9.8%/+3.5%
- Actual housing starts monthly change: +4.6%
- Expected/prior month building permits monthly change: –2.0%/–0.5%
- Actual building permits monthly change: +0.2%

Preliminary University of Michigan Consumer Sentiment Survey July (Friday)
Consumer sentiment improved modestly, due in part to falling inflation expectations.
- Expected/prior month sentiment: 61.5/60.7
- Actual month sentiment: 61.8
Key Takeaways from Reports
- A slightly stronger-than-expected inflation reading likely delayed Fed rate cuts until later this year as the central bank awaits more evidence of softening inflation.
- Positive news from retail sales and consumer sentiment provide a positive backdrop for continued economic growth.
Financial Market Data
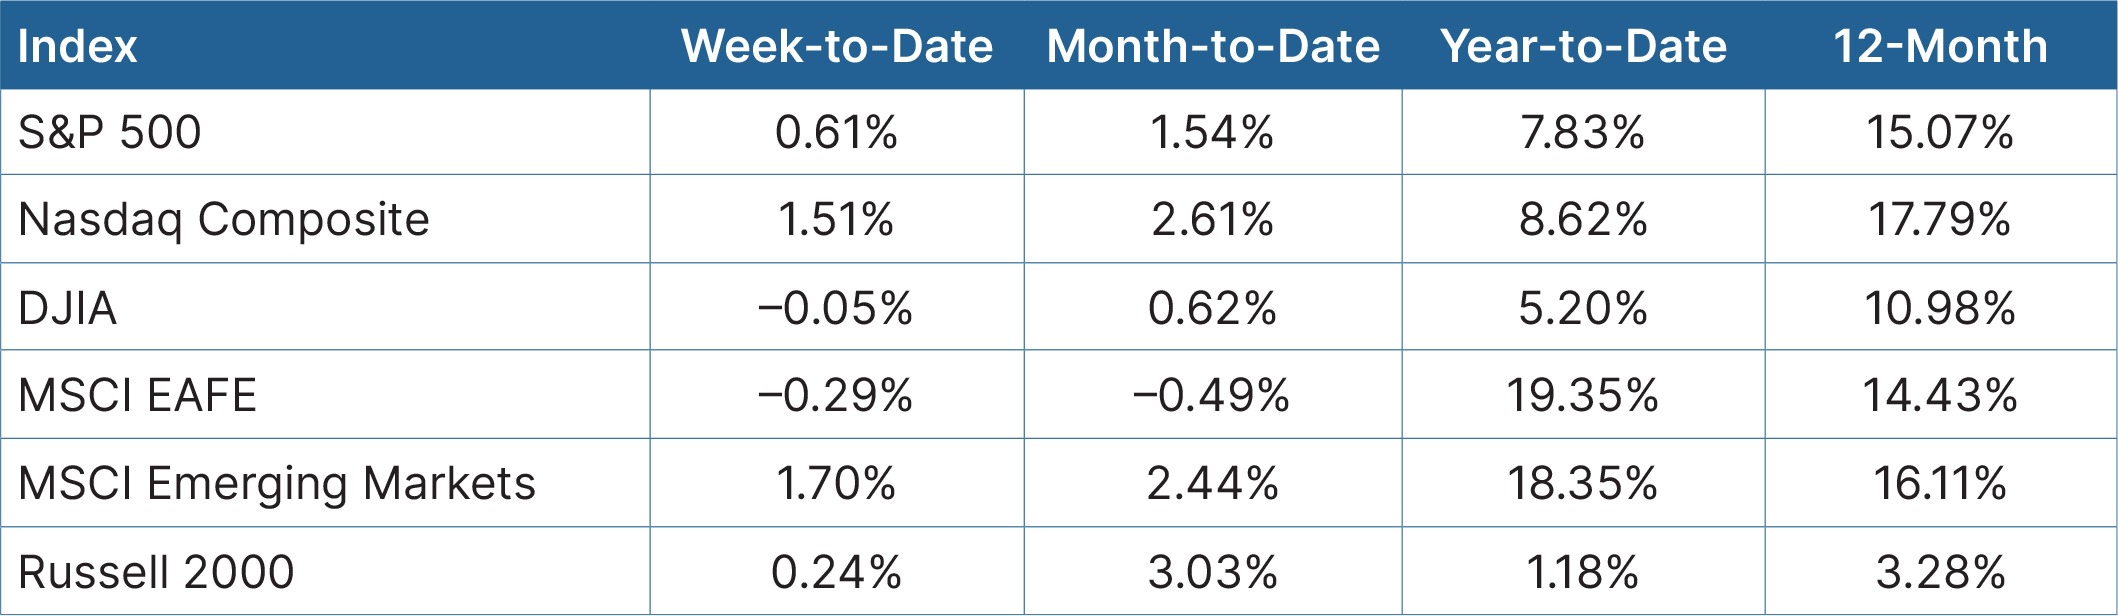
Equity
Source: Bloomberg, as of July 18, 2025
U.S. equities reached new highs thanks to the technology sector. Nvidia moved higher after it received assurances from the Trump administration that it could sell its H20 AI chip in China. Other chip-related firms also moved higher. Financials outperformed on solid earnings and a positive consumer backdrop. Underperforming sectors included energy, health care, and materials. Managed care organizations saw a decline as rising costs, insufficient pricing, and the expected impacts of H.R. 1 weighed on earnings expectations.
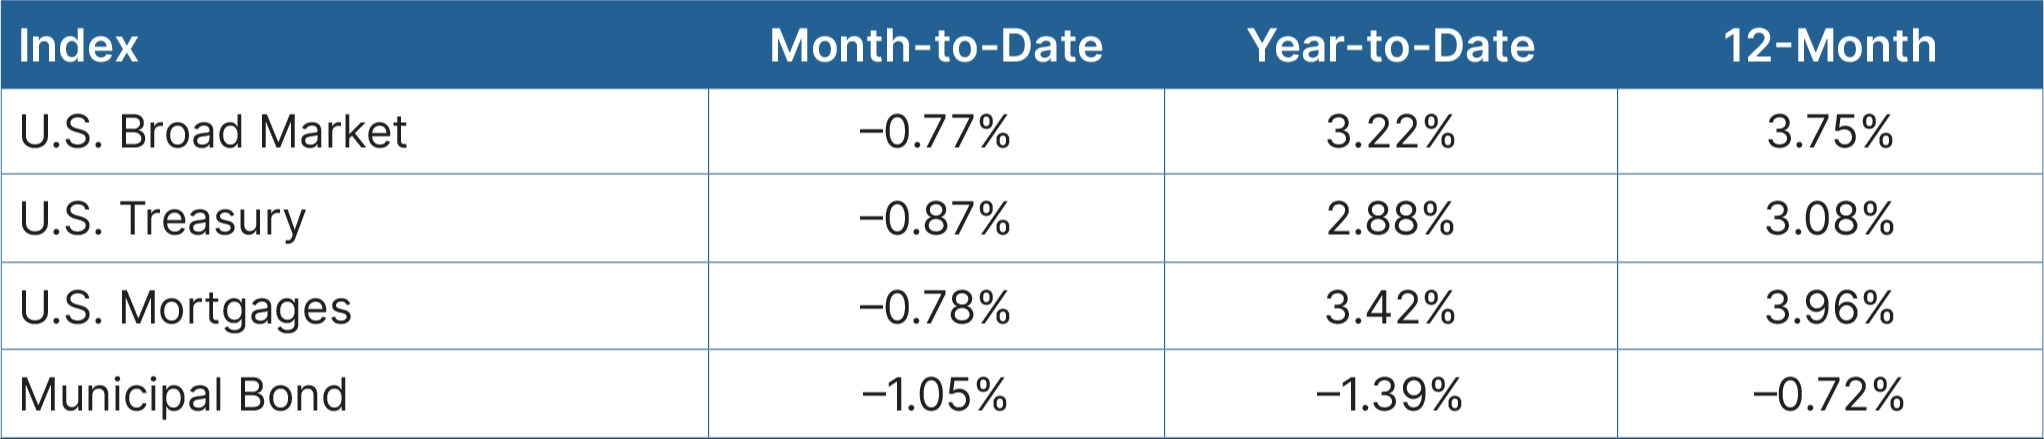
Fixed Income
Source: Bloomberg, as of July 18, 2025
U.S. Treasuries saw a steepening in the curve on concerns that President Trump was considering firing Fed Chair Powell, though the president denied those rumors. The inflation report saw a firming of yields as the likelihood of rate cuts were delayed after inflation came in higher than expected.
Key Takeaways
- Equities continued to see positive results, driven largely by big tech. After a solid start to 2025 for value companies, growth has seen significant outperformance in the second and third quarters.
- With the recent inflation report, interest rate cuts are likely to be pushed out until the end of the year.

Looking Ahead
It will be a light week for economic reports, with housing and durable goods expected to be the only major releases. This will be a busy week for earnings releases, with companies from several different industries reporting, which should help provide a snapshot of how the tug-of-war between value and growth companies will continue to play out.
- On Wednesday, existing home sales for June will be released; a 0.7 percent decline is expected.
- Preliminary durable goods orders from June will be reported on Friday. They are expected to fall sharply after surging in May due to a volatile rise in transportation orders.
Disclosure: This material is intended for informational/educational purposes only and should not be construed as investment advice, a solicitation, or a recommendation to buy or sell any security or investment product. Investments are subject to risk including loss of principal. Some investments are not suitable for all investors and there is no guarantee that any investing goal would be met. Please contact your financial professional for more information specific to your situation.
Certain sections of this commentary contain forward-looking statements based on our reasonable expectations, estimates, projections, and assumptions. These views are subject to change at any time. Forward-looking statements are not guarantees of future performance and involve certain risks and uncertainties, which are difficult to predict. Past performance is not indicative of future results. Diversification does not assure a profit or protect against loss in declining markets. All indices are unmanaged, and investors cannot invest directly into an index. Unlike investments, indices do not incur management fees, charges or expenses.
Definitions: The Dow Jones Industrial Average is a price-weighted average of 30 actively traded blue-chip stocks. The S&P 500 Index is a broad-based measurement of changes in stock market conditions based on the average performance of 500 widely held common stocks. The Nasdaq Composite Index measures the performance of all issues listed in the Nasdaq Stock Market, except for rights, warrants, units, and convertible debentures. The MSCI EAFE Index is a float-adjusted market capitalization index designed to measure developed market equity performance, excluding the U.S. and Canada. The MSCI Emerging Markets Index is a market capitalization-weighted index composed of companies representative of the market structure of 26 emerging market countries in Europe, Latin America, and the Pacific Basin. It excludes closed markets and those shares in otherwise free markets that are not purchasable by foreigners. The Bloomberg Aggregate Bond Index is an unmanaged market value-weighted index representing securities that are SEC-registered, taxable, and dollar-denominated. It covers the U.S. investment-grade fixed-rate bond market, with index components for a combination of the Bloomberg government and corporate securities, mortgage-backed pass-through securities, and asset-backed securities. The Bloomberg U.S. Corporate High Yield Index covers the USD-denominated, non-investment-grade, fixed-rate, taxable corporate bond market. Securities are classified as high yield if the middle rating of Moody’s, Fitch, and S&P is Ba1/BB+/BB+ or below. One basis point (bp) is equal to 1/100th of 1 percent, or 0.01 percent.
Authored by the Investment Research team at Commonwealth Financial Network®.
© 2025 Commonwealth Financial Network®
Let’s Talk About Your Financial Future
Whether you’re navigating a volatile market or preparing for the future, we’re here to help.